
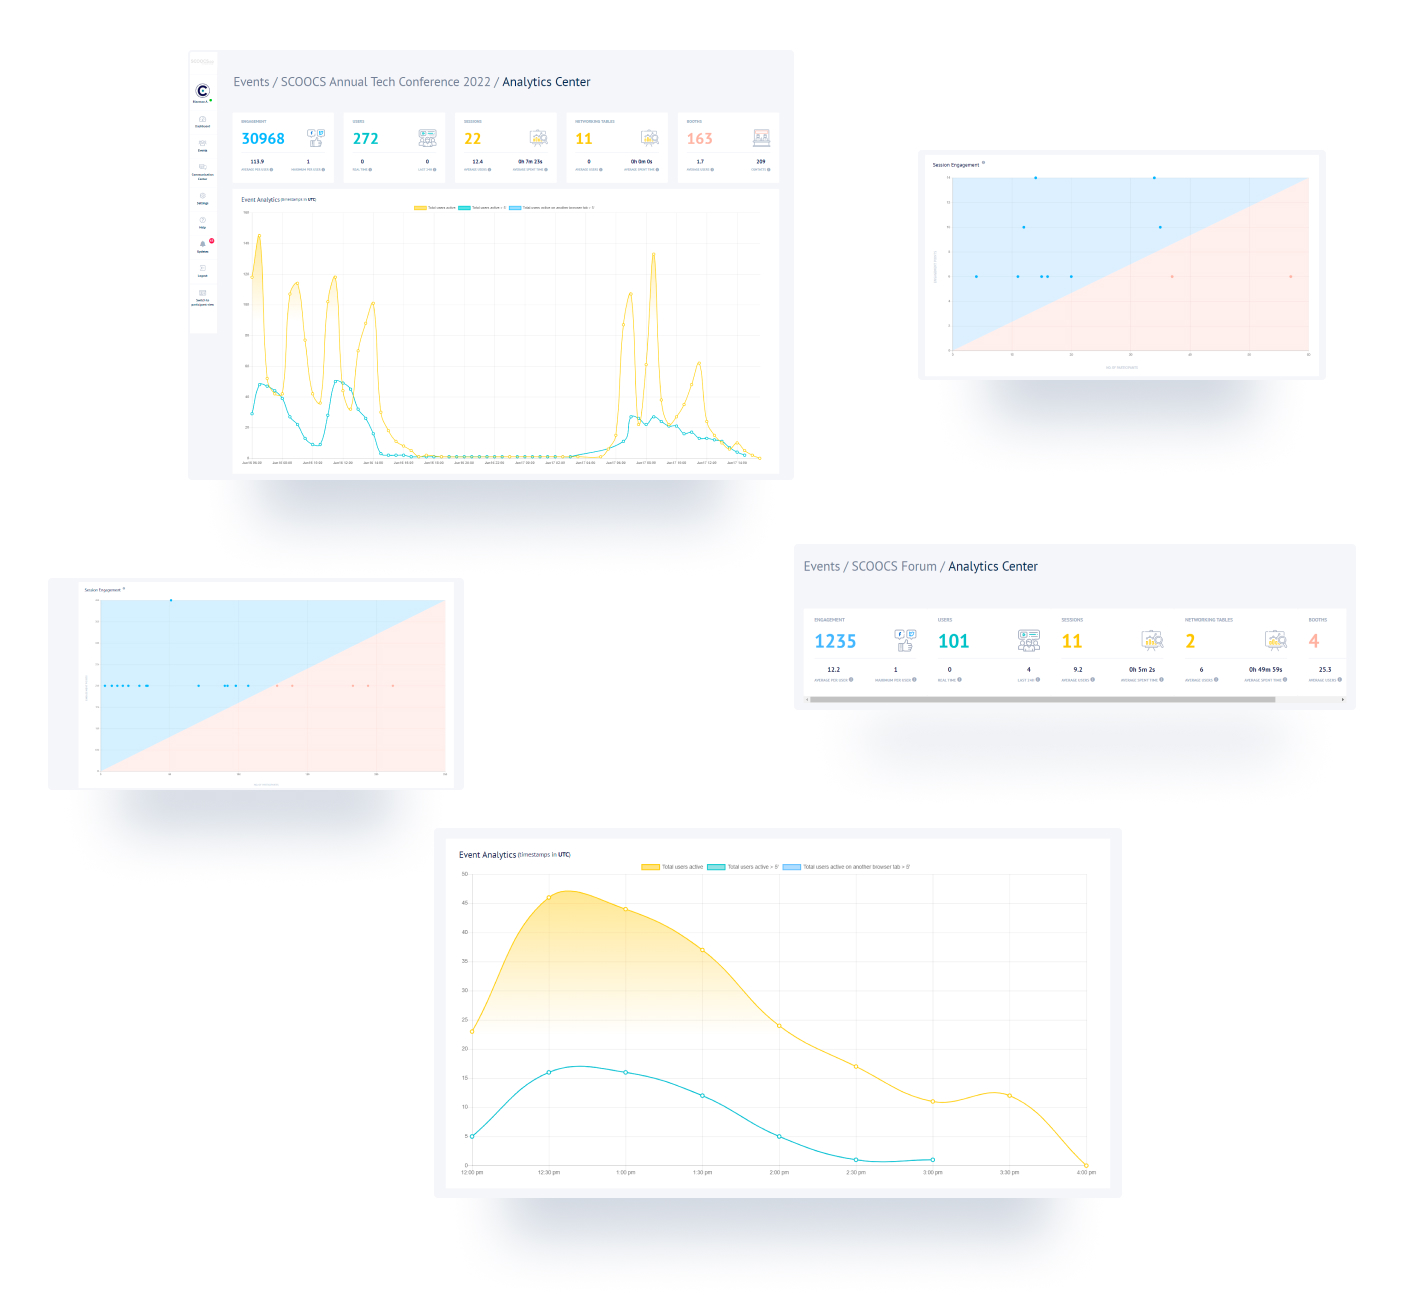
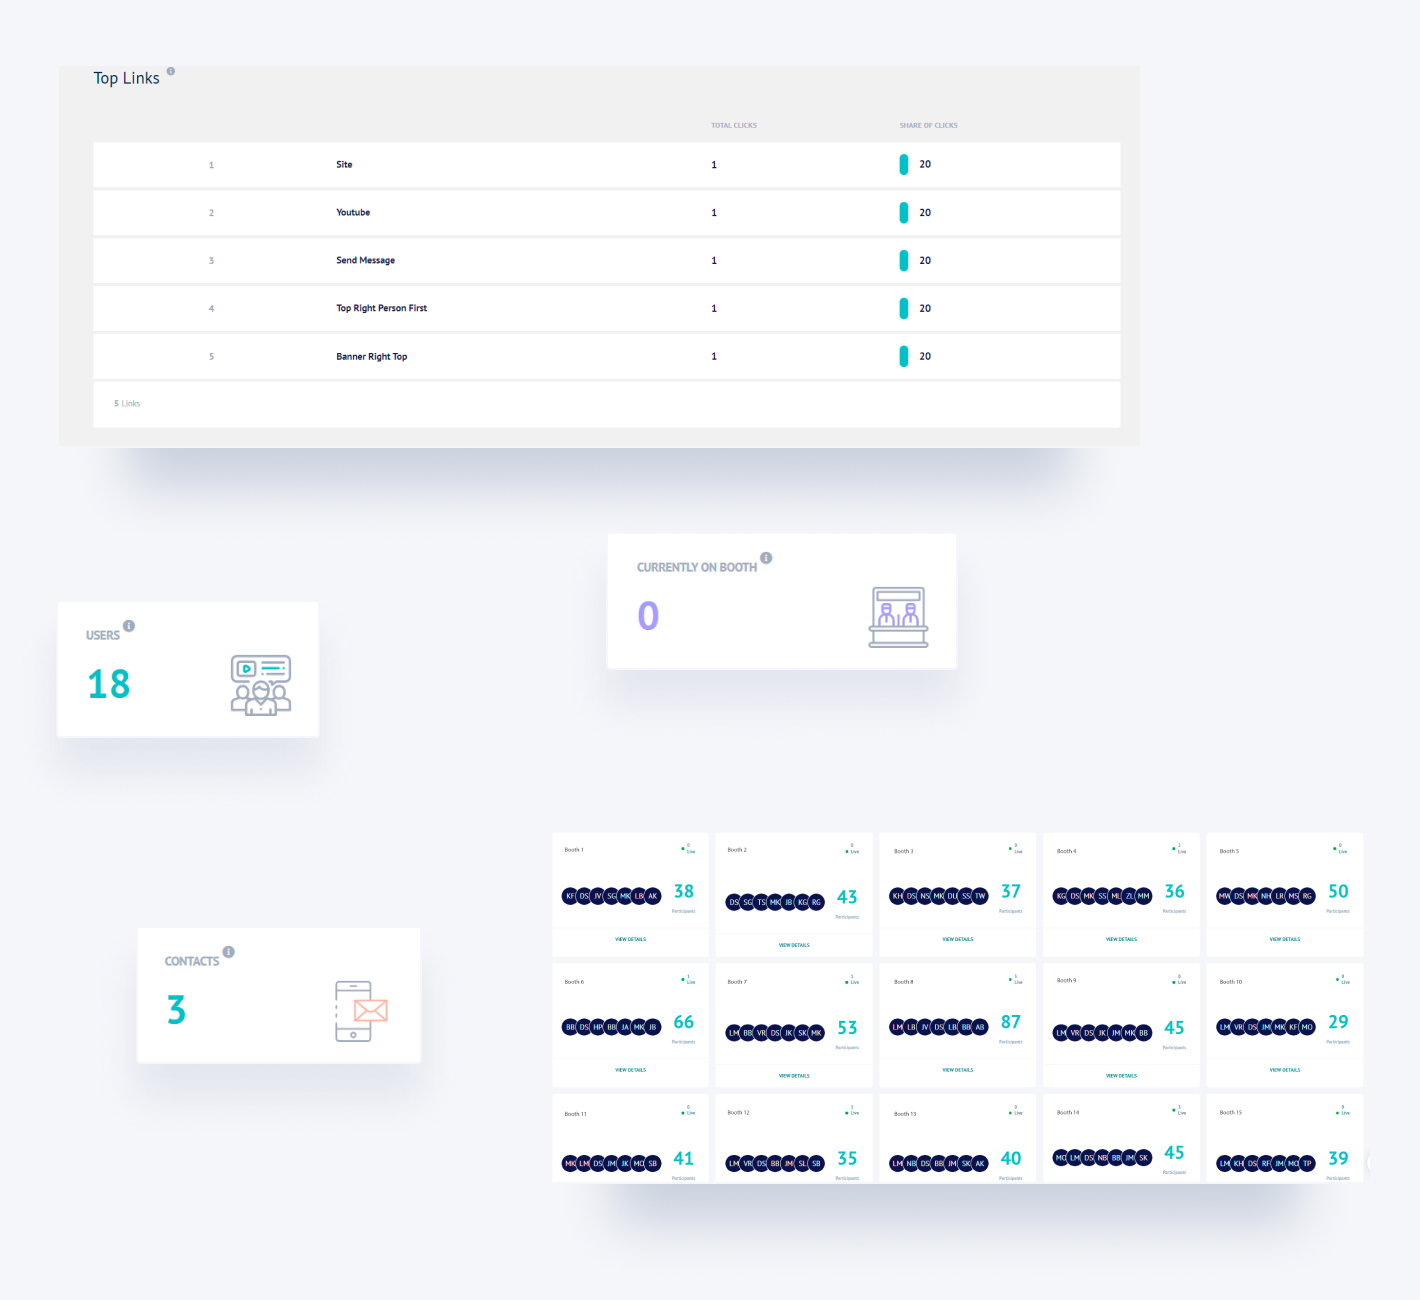
See how your event performance going on a glimpse, with the event analytics dashboard! Have a general overview of how many users are logged in real-time, the average user per session and also per hour and the time spent on the platform, and also the average number of users on the booths, and the number of contacts generated. Measure also the session’s engagement, and learn more about which of your engagement activities works best! You can also have access to more data on the raw data module.
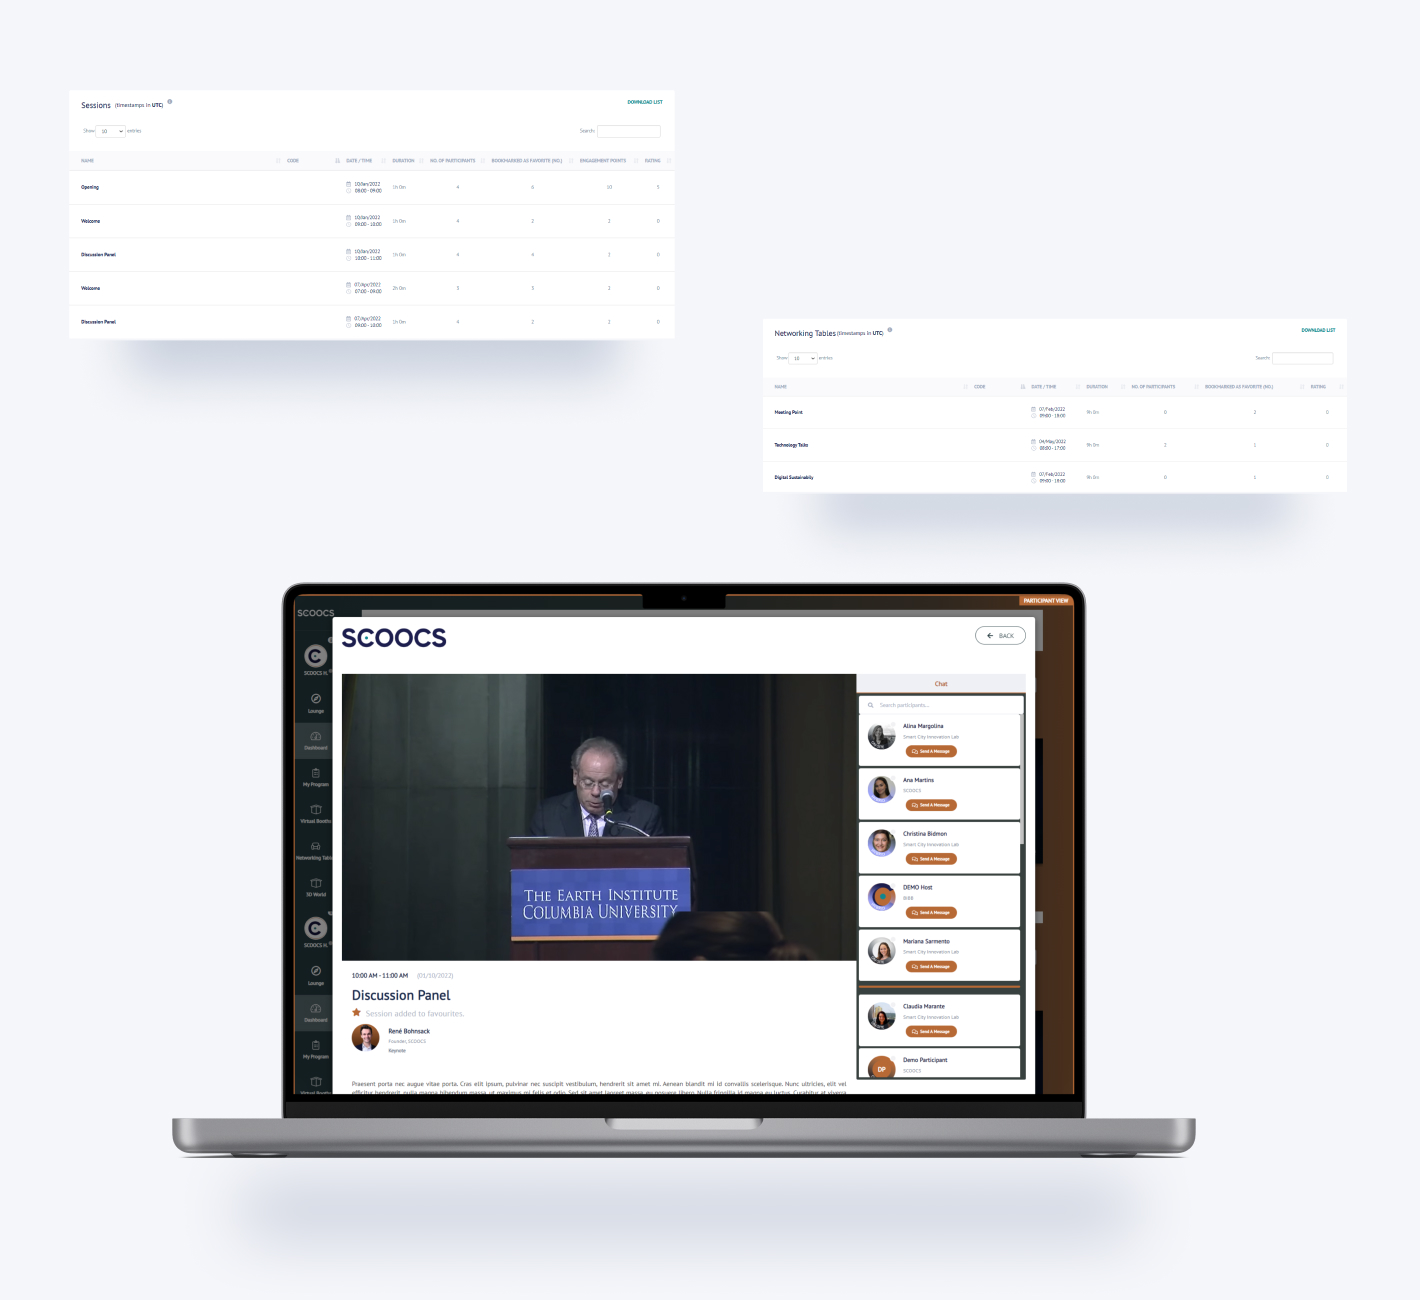
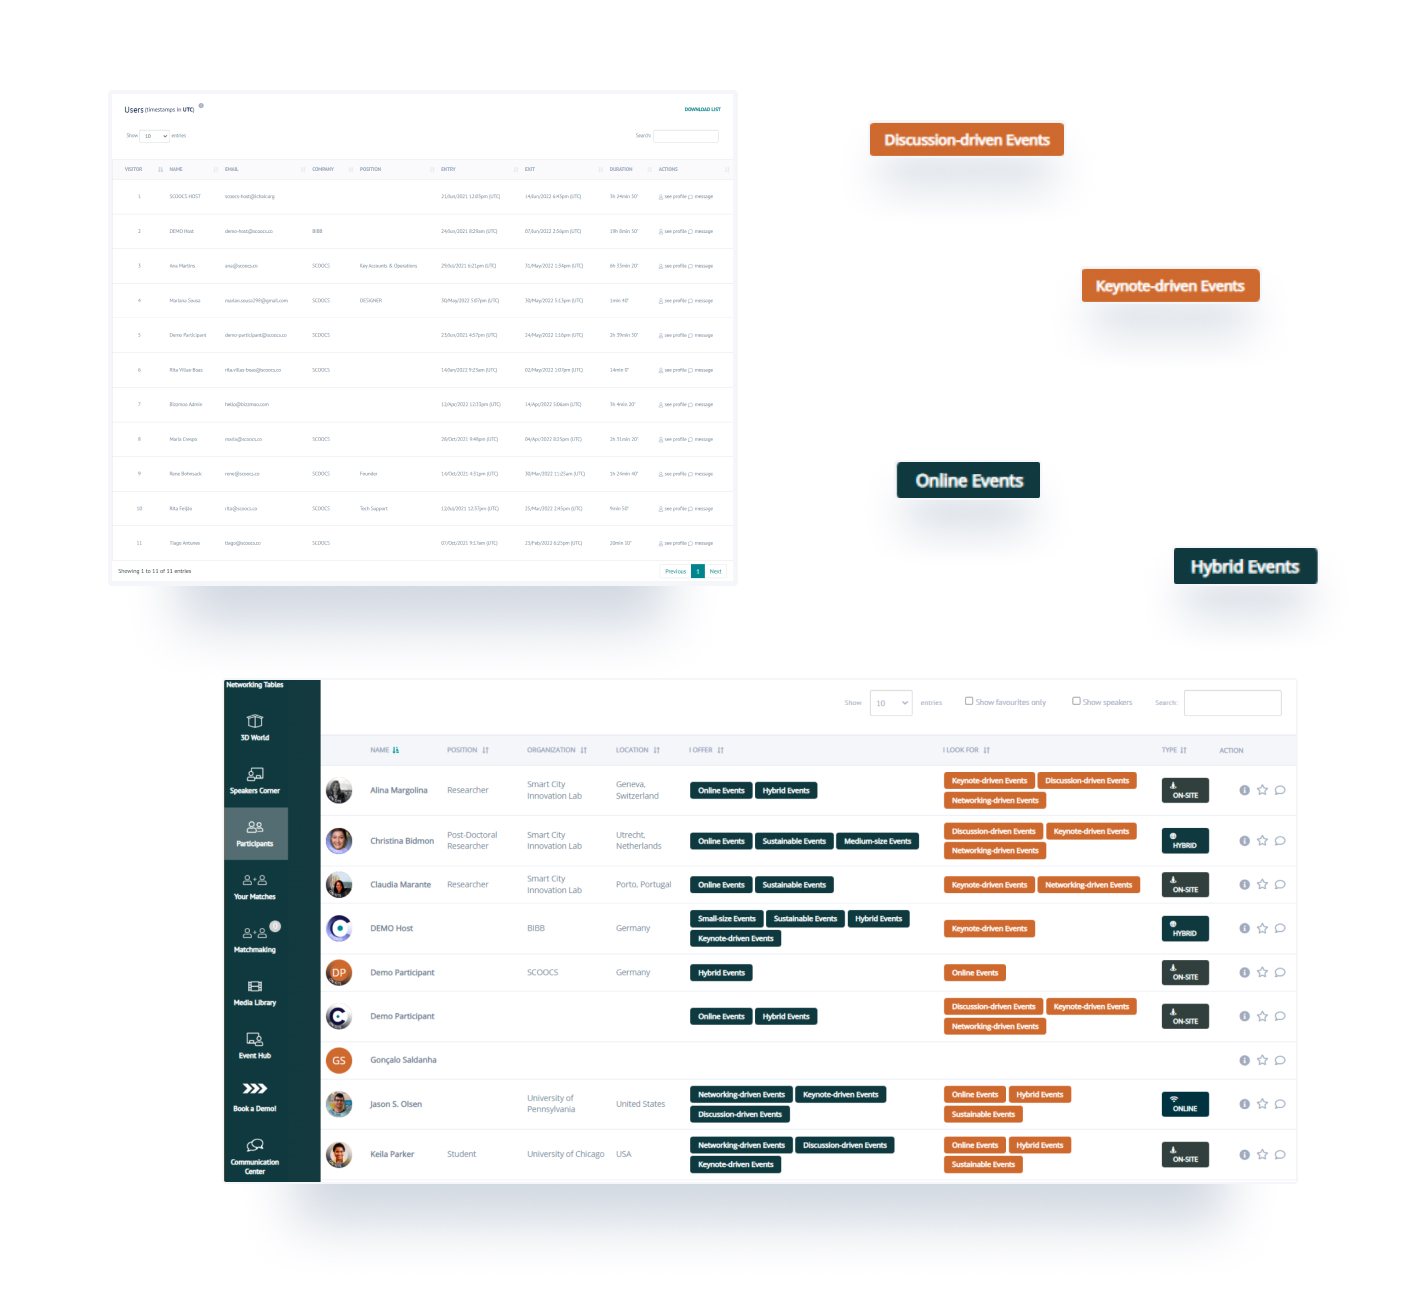
In this area of the event analytics area in the back office, you will learn everything about your sessions and your networking tables: the number of participants, the engagement points, the ratings, and also the number of times a session was bookmarked as a favorite! Download your data on an excel file to integrate with your analytics personal dashboard! Complete this information with the raw data module to see the full picture!
In the users’ data module, you will be able to learn when your attendees joined the platform and when they left. Monitor your accesses in real-time and take action: send a message directly from this module to the participants that are online, or send them an email with a time-sensitive message! Complete this information with the raw data module, to have a complete overview of your events’ results!
On the event analytics module, you will have a complete overview of your booths. In this overview, you can learn the total number of visitors since the beginning of the event, and also how many are live in real-time. Click on “view details” to learn more: check the dashboard with the visitors’ history, and the list with all the visitors’ names, emails, and entry and exit times. Take action, and send a private message or an email to your contacts!
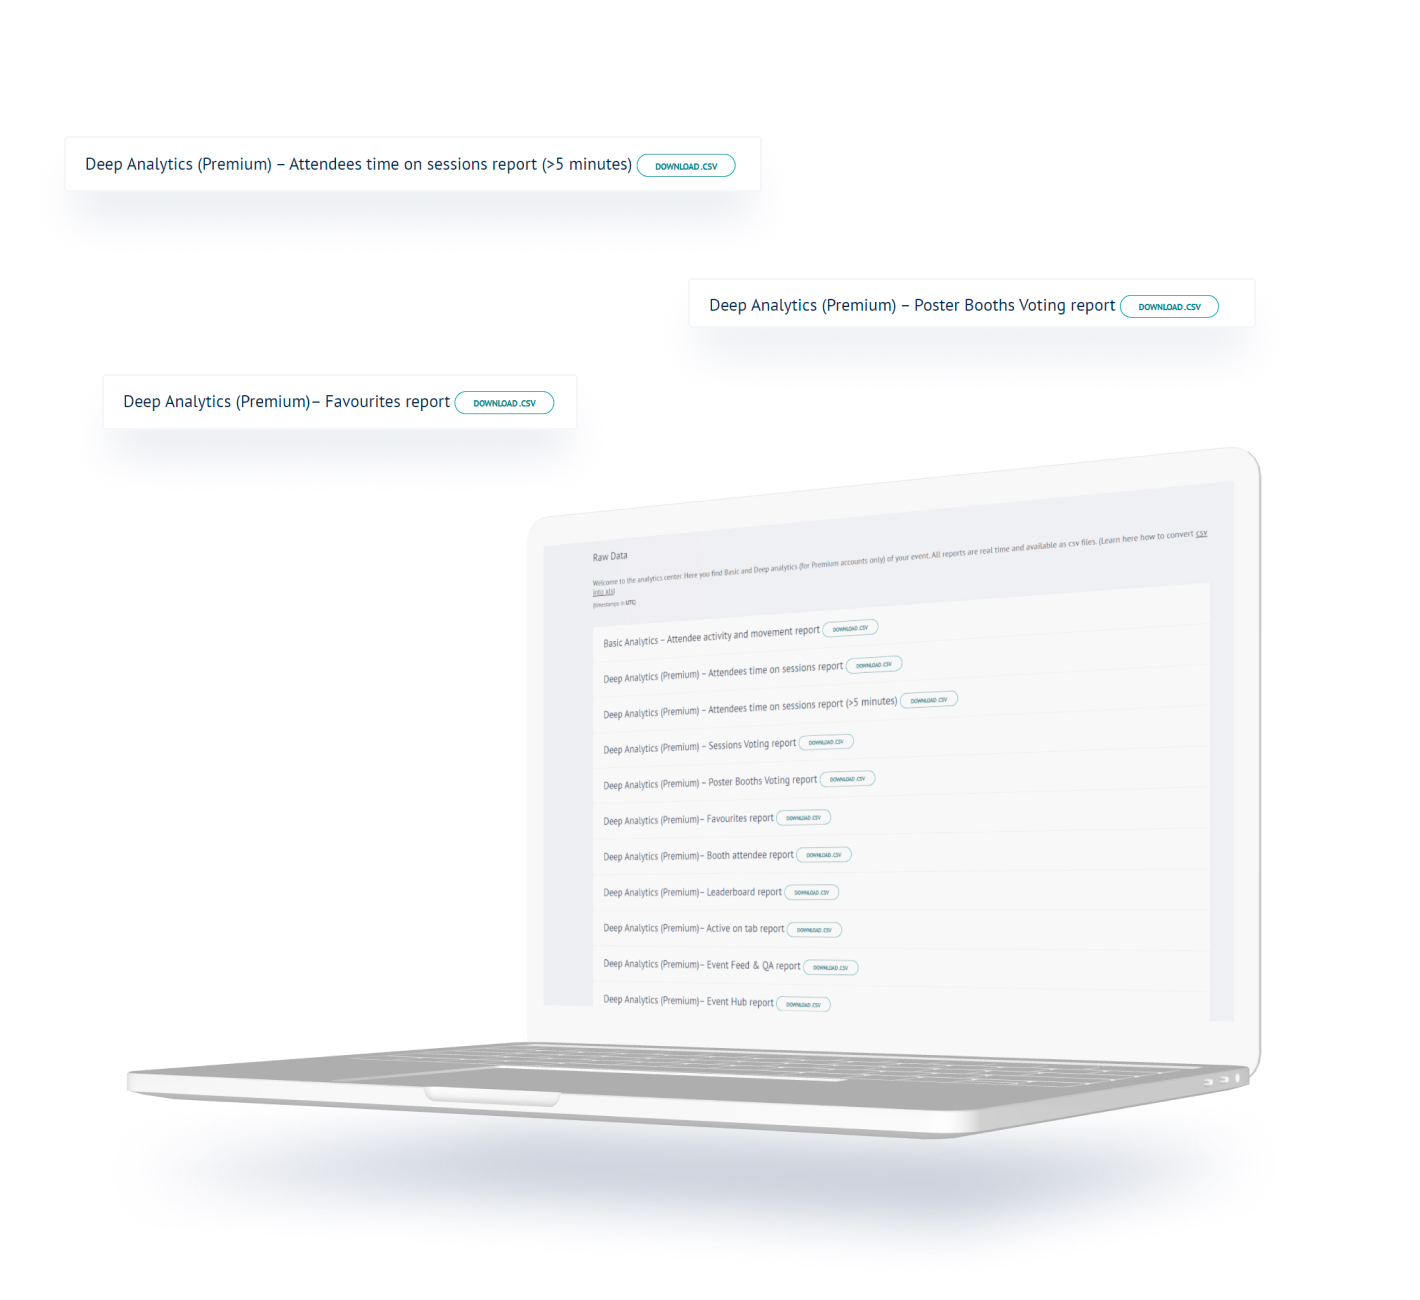
The raw data module is the place where you can find all the information about your event! Expect to find deep analytics with all the activity of your attendees: which are the sessions they attended, when they entered and exited on each session, a sessions voting and poll report, a complete engagement and co2 savings report, and also a complete booth attendance report or the event feed or Q&A’s detailed activity. Download all the information in an excel to integrate this data with your analytics tool!